Rooftop solar cost cuts lag utility-scale market as soft costs bite
U.S. commercial rooftop PV developers must transfer technology and design learnings from utility-scale projects and optimize sales and marketing fees to cut the soft cost premium on distributed grid projects, industry experts said.

Related Articles
The U.S. is expected to install more than 40 GW of PV capacity between 2017-2019, driven by demand for commercial and utility-scale ground mount systems, according to the latest forecasts from IHS Markit Technology. Ground mount projects are expected to account for 70% of new installations.
Costs have continued to fall in residential, commercial and utility-scale PV markets due to lower module and inverter prices, lower installer and developer overheads, improved labor productivity and optimized system configurations.
However, the latest data shows commercial rooftop developers are falling behind ground-based projects in terms of cost reductions.
IHS estimates the CAPEX of commercial rooftop PV systems will be $1.70-$2.20/W in the first quarter of 2017. In comparison, CAPEX for ground mount PV systems of capacity over 5 MW is estimated at $1.10-$1.56/W.
The cost advantage for ground-based projects is set to widen as developers introduce pre-assembly and customized design testing to large-scale projects to further optimize labor and other soft cost components.
CAPEX costs for ground mount utility-scale projects is predicted to fall by 15%-20% this year while costs for non-residential rooftop PV systems will drop by 10%-15%, according to IHS.
The below graphic published by the National Renewable Energy Laboratory (NREL) in September illustrates how soft costs such as labor, permitting, land acquisition and customer acquisition margins, remain a significant cost component for commercial rooftop PV projects.
NREL noted the rising importance of soft costs in recent years as the pace of cost reductions in modules and inverters slowed.
Solar project costs reductions in 2009-2016

Source: NREL's 'US solar photovoltaic system cost benchmark Q1 2016 Report.' (September 2016)
Scaling up
Economies of scale on larger utility-scale ground mount projects generate a number of installation and O&M efficiencies, according to Brian Stallman, vice president of Renewable Development at Duke Energy.
“Scale and the standardization that comes along with that scale is certainly very important,” he said. “It helps drive a number of things, from a [labor] mobilization perspective, from the size of the inverter that you can deploy on a cost-per-watt basis, to land efficiencies and panel delivery efficiencies.”
Economies of scale by cost component
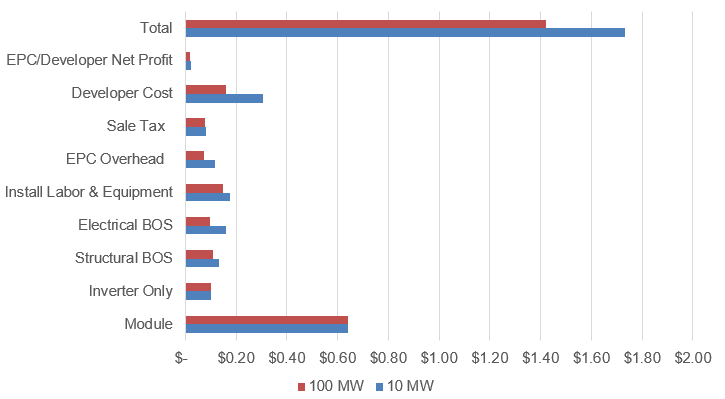
Data source: NREL's 'US solar photovoltaic system cost benchmark Q1 2016' (September 2016)
Smaller rooftop projects do not have such access to economies of scale and competition in sales and marketing remains a challenge for developers.
“What is holding back cost reduction in the rooftop space in distributed generation, more than on the utilities' ground-mounted projects, are the softer costs related to development and sales process,” Camron Barati, Solar Analyst at IHS, said.
“It is a sales and marketing issue, especially in the commercial market which can be quite complex and intensive in requiring a lot of investment just to capture more customers,” he said.
Rooftop developers could lower soft costs by integrating higher performance equipment and system designs while offering customers more diversified financing options, Barati said.
O&M competition
Increased market competition has seen solar operations and maintenance (O&M) prices fall heavily in recent years, particularly for utility-scale ground mount projects.
Innovations in plant design, component improvements and the clustering of maintenance services are pushing utility-scale O&M costs close to $8,000/MW/year, the cost the National Renewable Energy Laboratory forecast for 2020, industry experts told PV Insider in November.
Commercial rooftop plant operators could transfer some of the innovations in ground-based projects into the roof-based market to lower O&M costs.
Developers of distribution grid projects should leverage the latest plant monitoring technology to limit the number of site visit 'truck rolls' and control the costs of servicing of a portfolio, Mike Moone, Director, Energy Assurance at SunPower, said at the PV Operations & Maintenance USA conference on December 7.
Moone said operators in the residential market, for example, can use the latest infrared scanning and plant modeling technology to reduce truck rolls and increase the return on maintenance activities.
IHS predicts PV O&M prices will fall by between 4% and 6% this year, on average, as labor rate adjustments and greater project concentrations pressure costs, Barati said.
Growth areas
While they remain in place, federal and state renewable energy incentives continue to steer the concentration of PV installation in each state.
Despite high development and land costs in California and Hawaii, demand for new projects has remained strong as attractive Power Purchase Agreements have compensated for high development and land costs in the states, David Feldman, senior financial analyst at the National Renewable Energy Laboratory (NREL), said.
“California and Hawaii have some of the highest prices for electricity in the country which make solar more able to compete on prices than in other places,” he said.
Distributed solar capacity; top 10 states (September 2016)
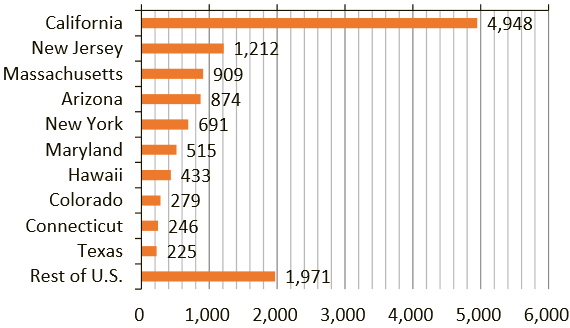
Source: US Department of Energy's SunShot initiative
IHS predicts California, Texas, Florida, Arizona and Nevada will lead installations of ground mount systems in 2017-2019, while California, New York, Massachusetts, Maryland and New Jersey are expected to be the top states for large-scale rooftop projects.
California, Hawaii as well as Nevada and Vermont are all projected to see solar penetration rates above 20% by 2021, according to data from the U.S. Department of Energy SunShot Initiative.
These states will far outstrip the average penetration rate in the U.S. which is forecast to remain below 3% for the next five years.
By Anna Flávia Rochas